Processing tables in documents and images
Probably most of the scientific information is captured in tables – for example in US patents from 2001-2017 we have extracted more than 10 million tables containing interesting properties on materials and compounds.
At OntoChem we have developed several technologies to extract this knowledge over the last 5 years. These software modules may read different input formats and write CSV, JSON or XML as a result. In addition, the final goal is to extract all data points from those tables. To achieve this, we need to know what is meant by column and row headers to add the respective X-Y-cell data. Very often, the meaning of those values is only understood when also considering the references to this table in the full text – this is what we call “anchoring text”. Thus, combining text and normalized table information, we have dedicated table extraction modules that are able to extract scientific data points of interest, e.g. like melting points, viscosities or alike.
XML type tables
These tables are normalised, combined cells, rows and columns are resolved, annotated and extracted to yield semantic triples: X-Y-values
converting a 5 tgroup, 1 empty header, 5 tbody XML table from US-20160002222-A1
into a normalized, 1 thead, 1 tbody, 1 tfoot, 1 anchoring text table.
Example for extracting semantic content:
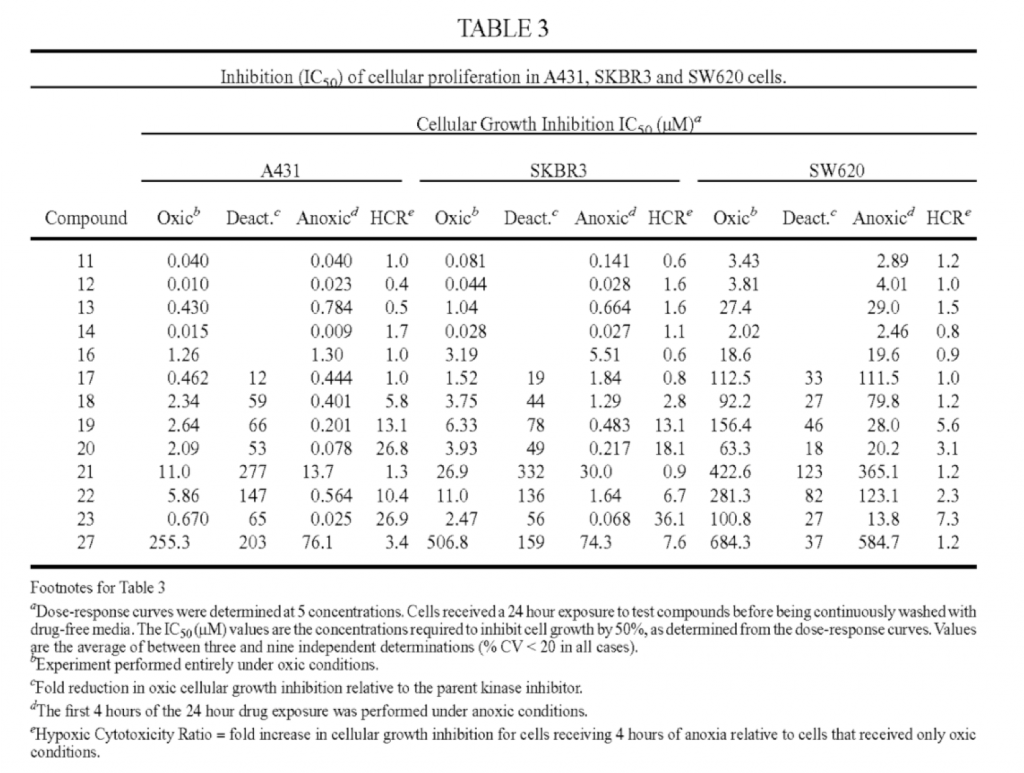
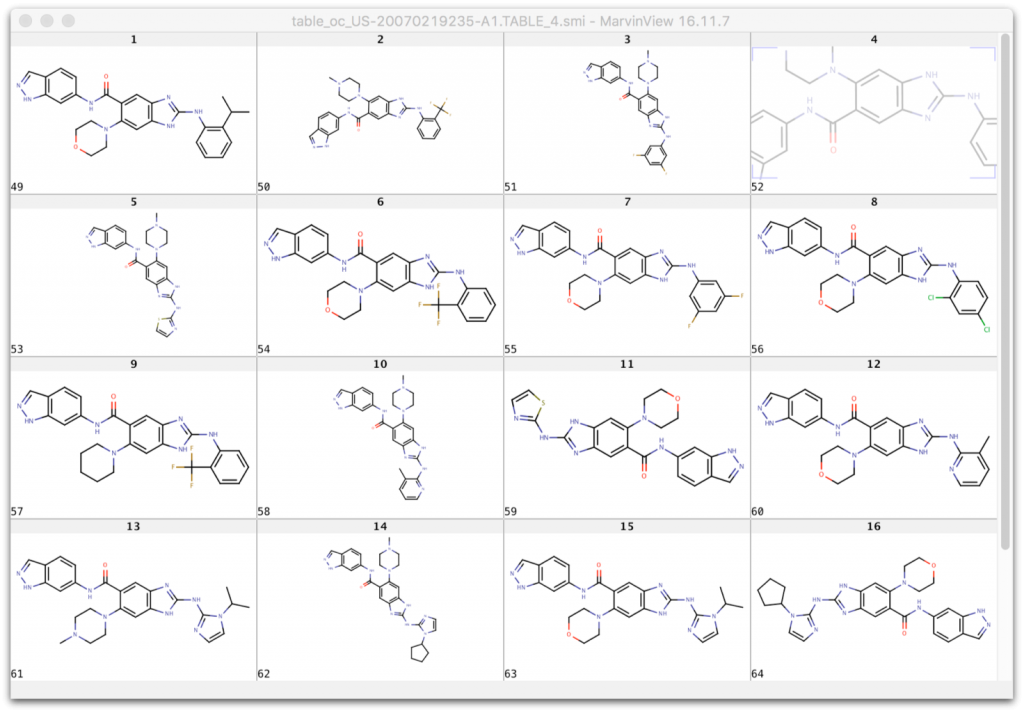
A table from US-20070219235-A1 is used
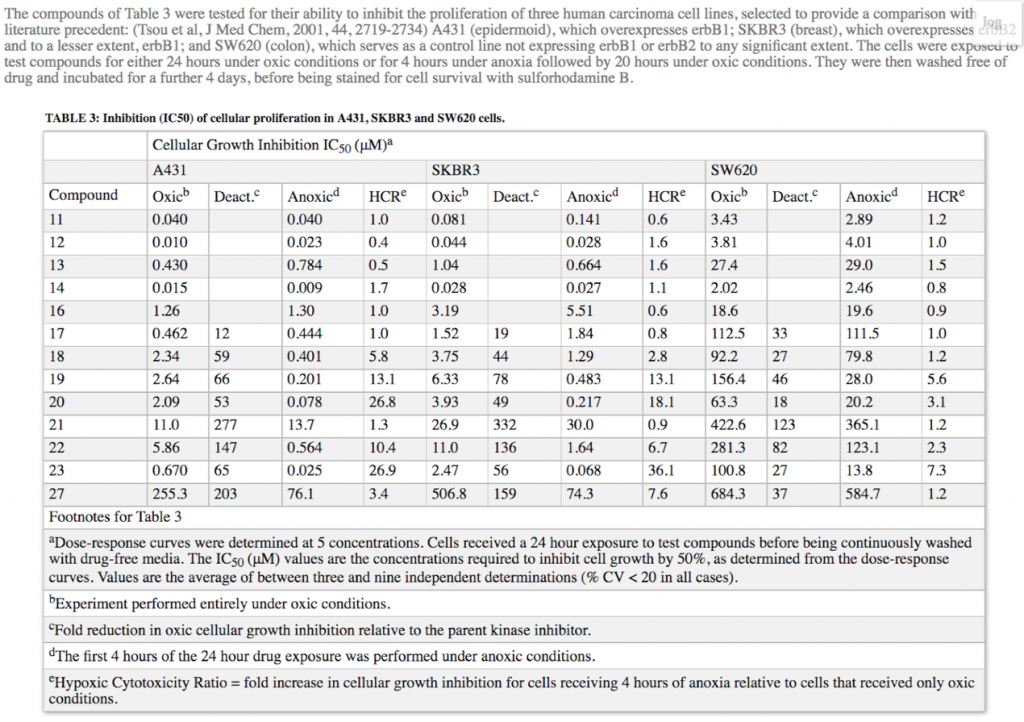
to produce a normalized table
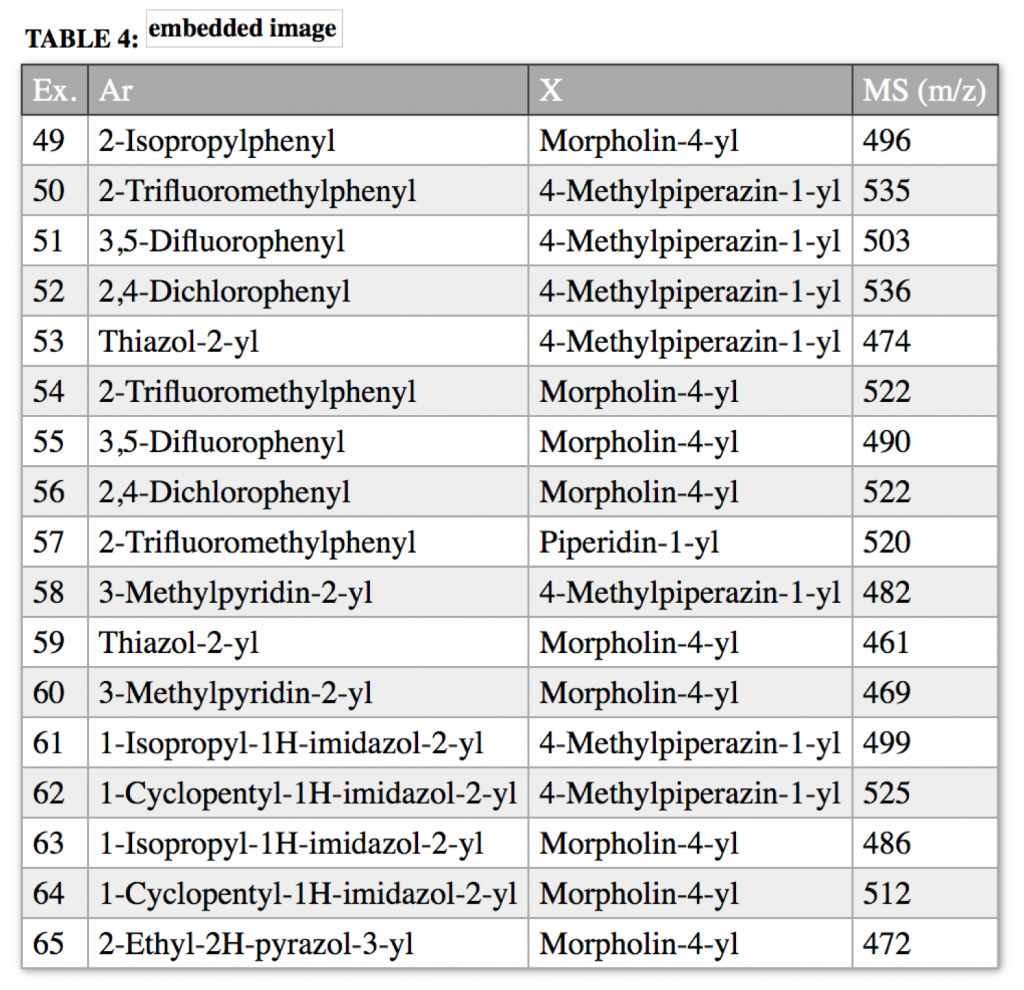
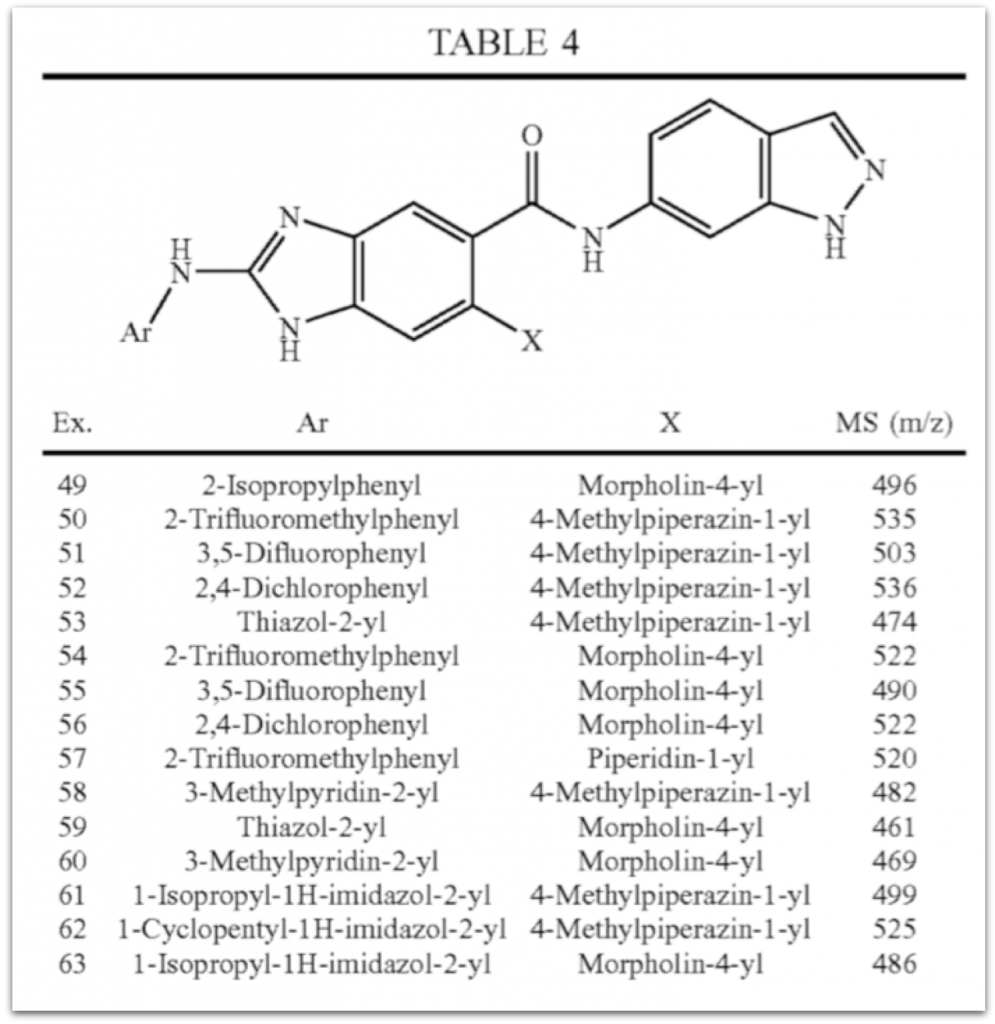
that also includes an embedded chemistry scaffold image and structure:
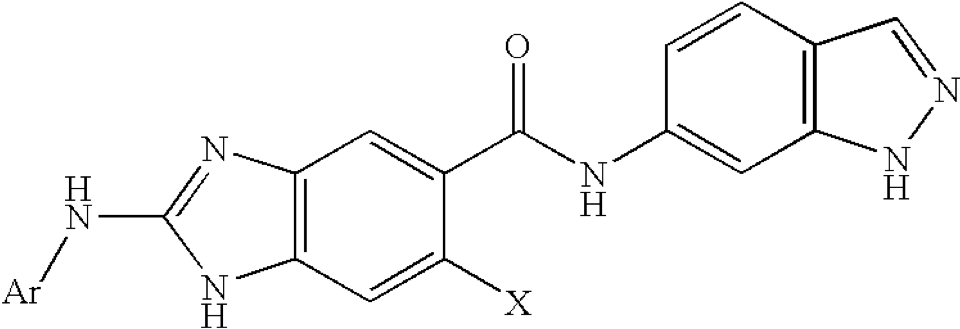
when replacing Ar and X with the substituents from the table columns we enumerate all molecules of this table using our Markush puzzler module:
Text type tables
using an x,y coordinates rule-based module cells are assigned to the text chunks to create an XML table for further processing:
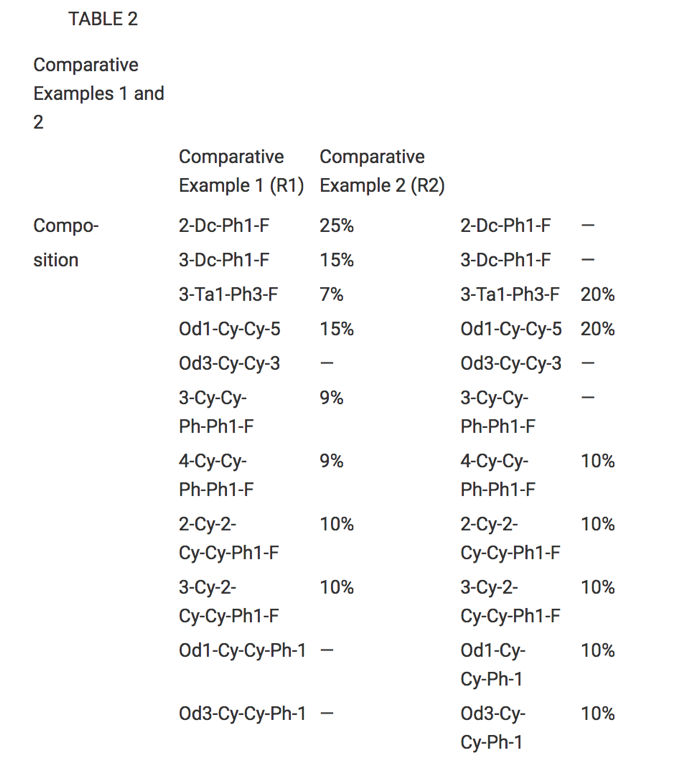
into a 1 thead, 1 tbody, 1 tfoot table:
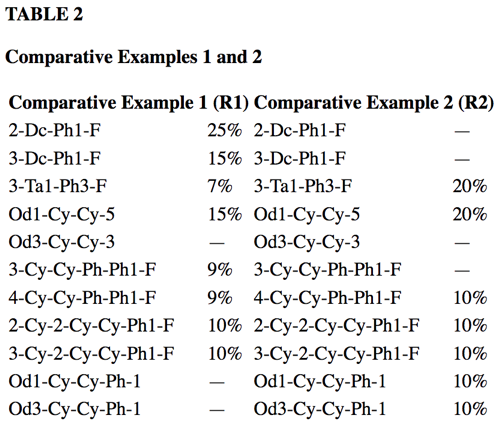
Image type tables with separating lines
If a table has separating lines, e.g. like often found in patent table images, we developed image2table. This uses image processing algorithms to reconstruct the table cells and positions and OCR Tesseract (https://github.com/tesseract-ocr/tesseract) to extract the table contents and generate XML/HTML tables.
Example table image from patent with number WO-1994001413-A1
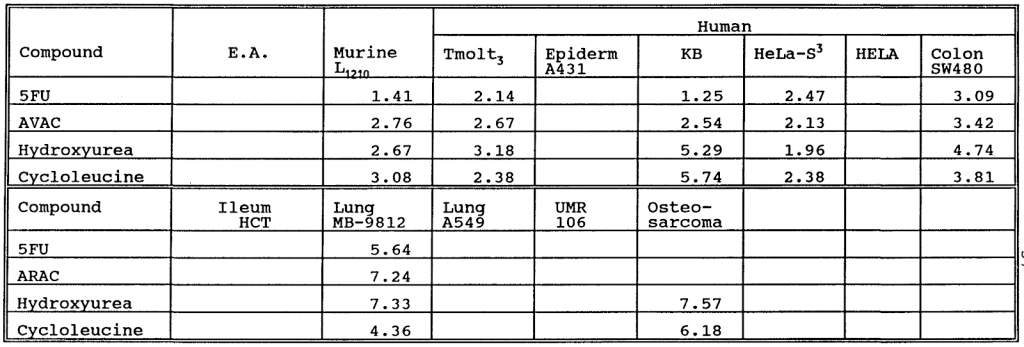
image2table output:
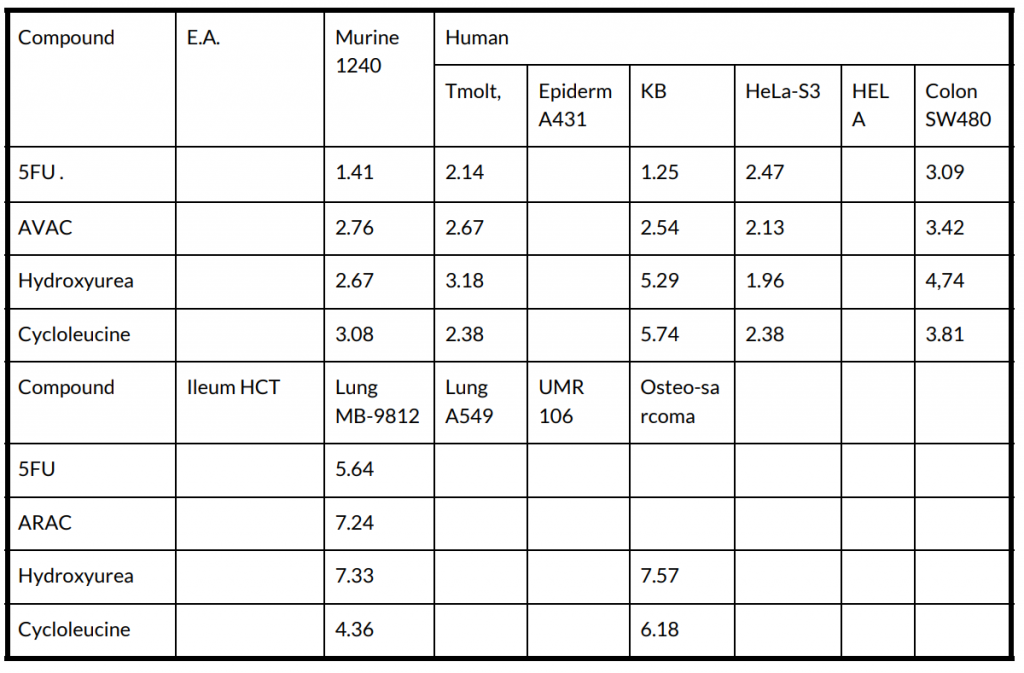
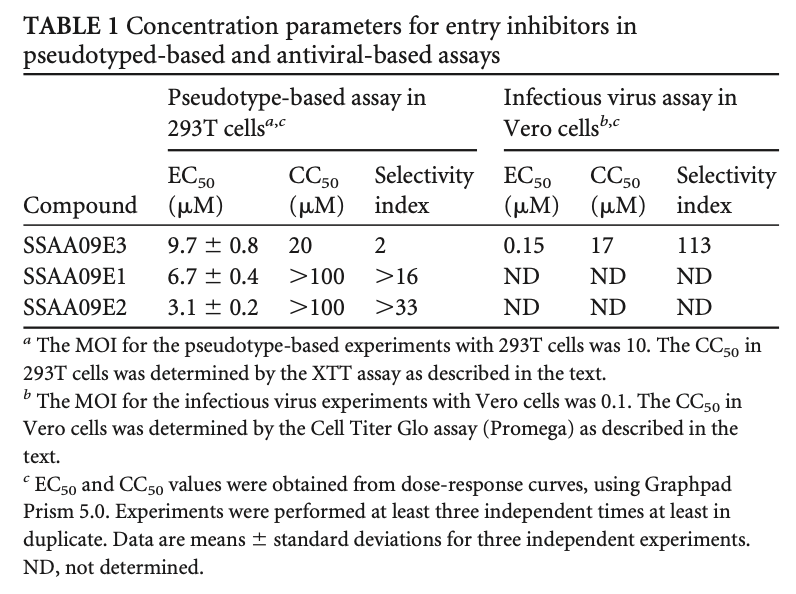
Image type tables without separating lines
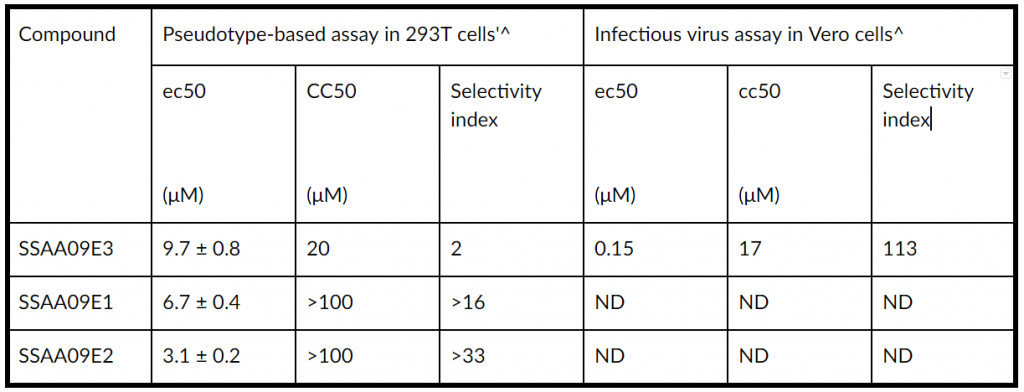
This is the most difficult case and results vary widely with the quality of the input. Here ABBYY Finereader or other more advanced OCR tools could be used to produce an intermediate HTML table that is processed further by the module 1:
doi:10.1128/JVI.00998-13: Novel Inhibitors of Severe Acute Respiratory Syndrome Coronavirus Entry That Act by Three Distinct Mechanisms by Adeyemi O. Adedeji et al.
ABBYY FineReader output:
TABLE 1 Concentration parameters for entry inhibitors in pseudotyped-based and antiviral-based assays
a The MOI for the pseudotype-based experiments with 293T cells was 10. The CC50 in 293T cells was determined by the XTT assay as described in the text.
b The MOI for the infectious virus experiments with Vero cells was 0.1. The CC50 in Vero cells was determined by the Cell Titer Gio assay (Promega) as described in the text.
c EC50 and CC50 values were obtained from dose-response curves, using Graphpad Prism 5.0. Experiments were performed at least three independent times at least in duplicate. Data are means ± standard deviations for three independent experiments. ND, not determined.